

The Community Management Report

Key Takeaways
Instagram is the most-used platform for communities to interact with brands, with DMs being the most popular message type.
YouTube and Facebook require far more moderation from brands than other social networks.
The amount of moderation required varies hugely by industry, with the heavily regulated pharmaceuticals industry requiring the most.
Likewise, the time in which brands must respond to their customers’ messages also varies by industry. Finance & insurance companies require the fastest responses.
Brands respond faster on X and Instagram than on other social networks.
Community management is a complex challenge for modern brands, and one that is extremely visible. Brand communities are spread across a sea of online platforms and interact in a variety of different ways. Brands need to manage not just public comments and private messages, but a variety of mentions, reviews, and conversations that require sophisticated social listening to monitor effectively.
Every community also comes with its own expectations, platform norms, and regulatory considerations. Brands must balance responsiveness, moderation, compliance, and customer care while operating at scale.
At ICUC, we manage communities and interactions like these in huge numbers every day. This report is built directly from that data to explore where interaction is growing, where moderation is most needed, and where response expectations are changing fastest.
The Data
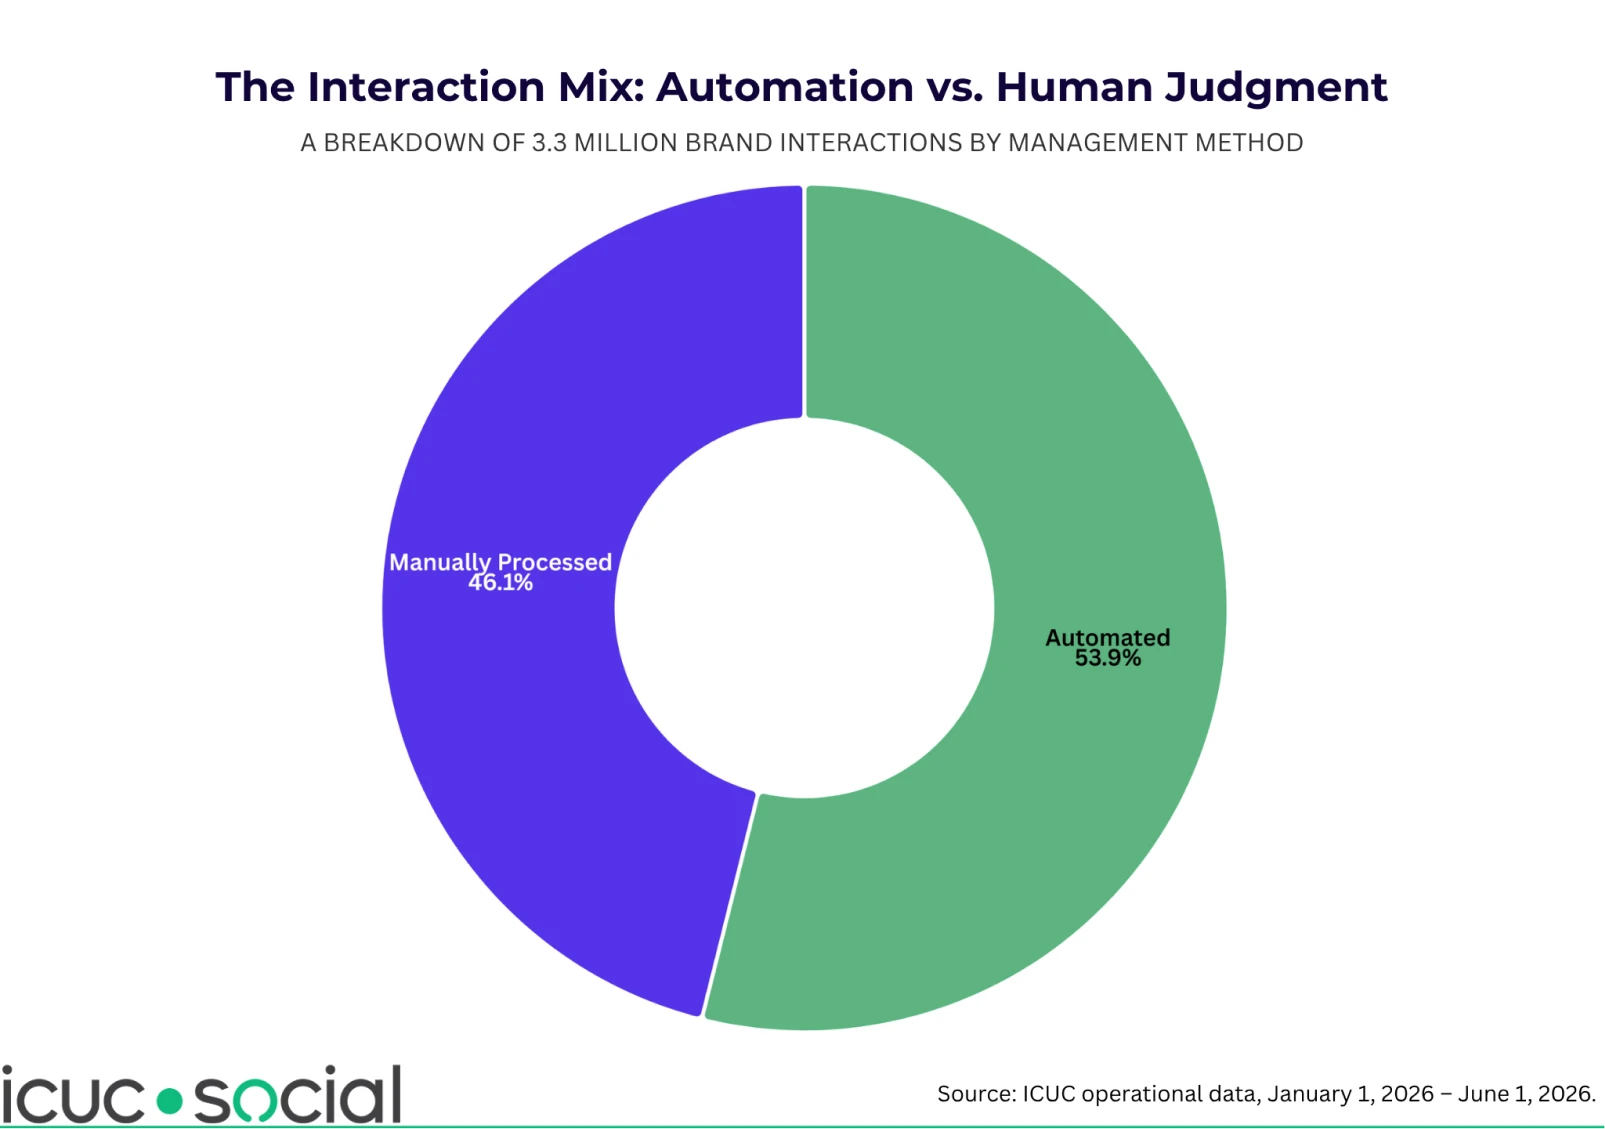
In the first 5 months of 2026, we analyzed roughly 2.7 million brand interactions, averaging more than half a million per month. 90% of those were in English, and the remaining 10% spanned 45 other languages.
Despite these large numbers, we are conservative with automating our workflow. Of the interactions that we handled, 46% were entirely manual. The remaining 54% used some form of automation to support the workflow; however, much of this is merely assistive. We use automation for classification, tagging, routing, or initial processing, before results are reviewed and actioned by analysts.
For us, automation is an assistive tool. We know that language is subtle, and though automation is becoming part of the infrastructure of community management, human judgment remains central to doing it well.
So, with volume in mind, in which platforms and channels do customer-to-brand interactions occur online?
The Channels of Brand Interaction
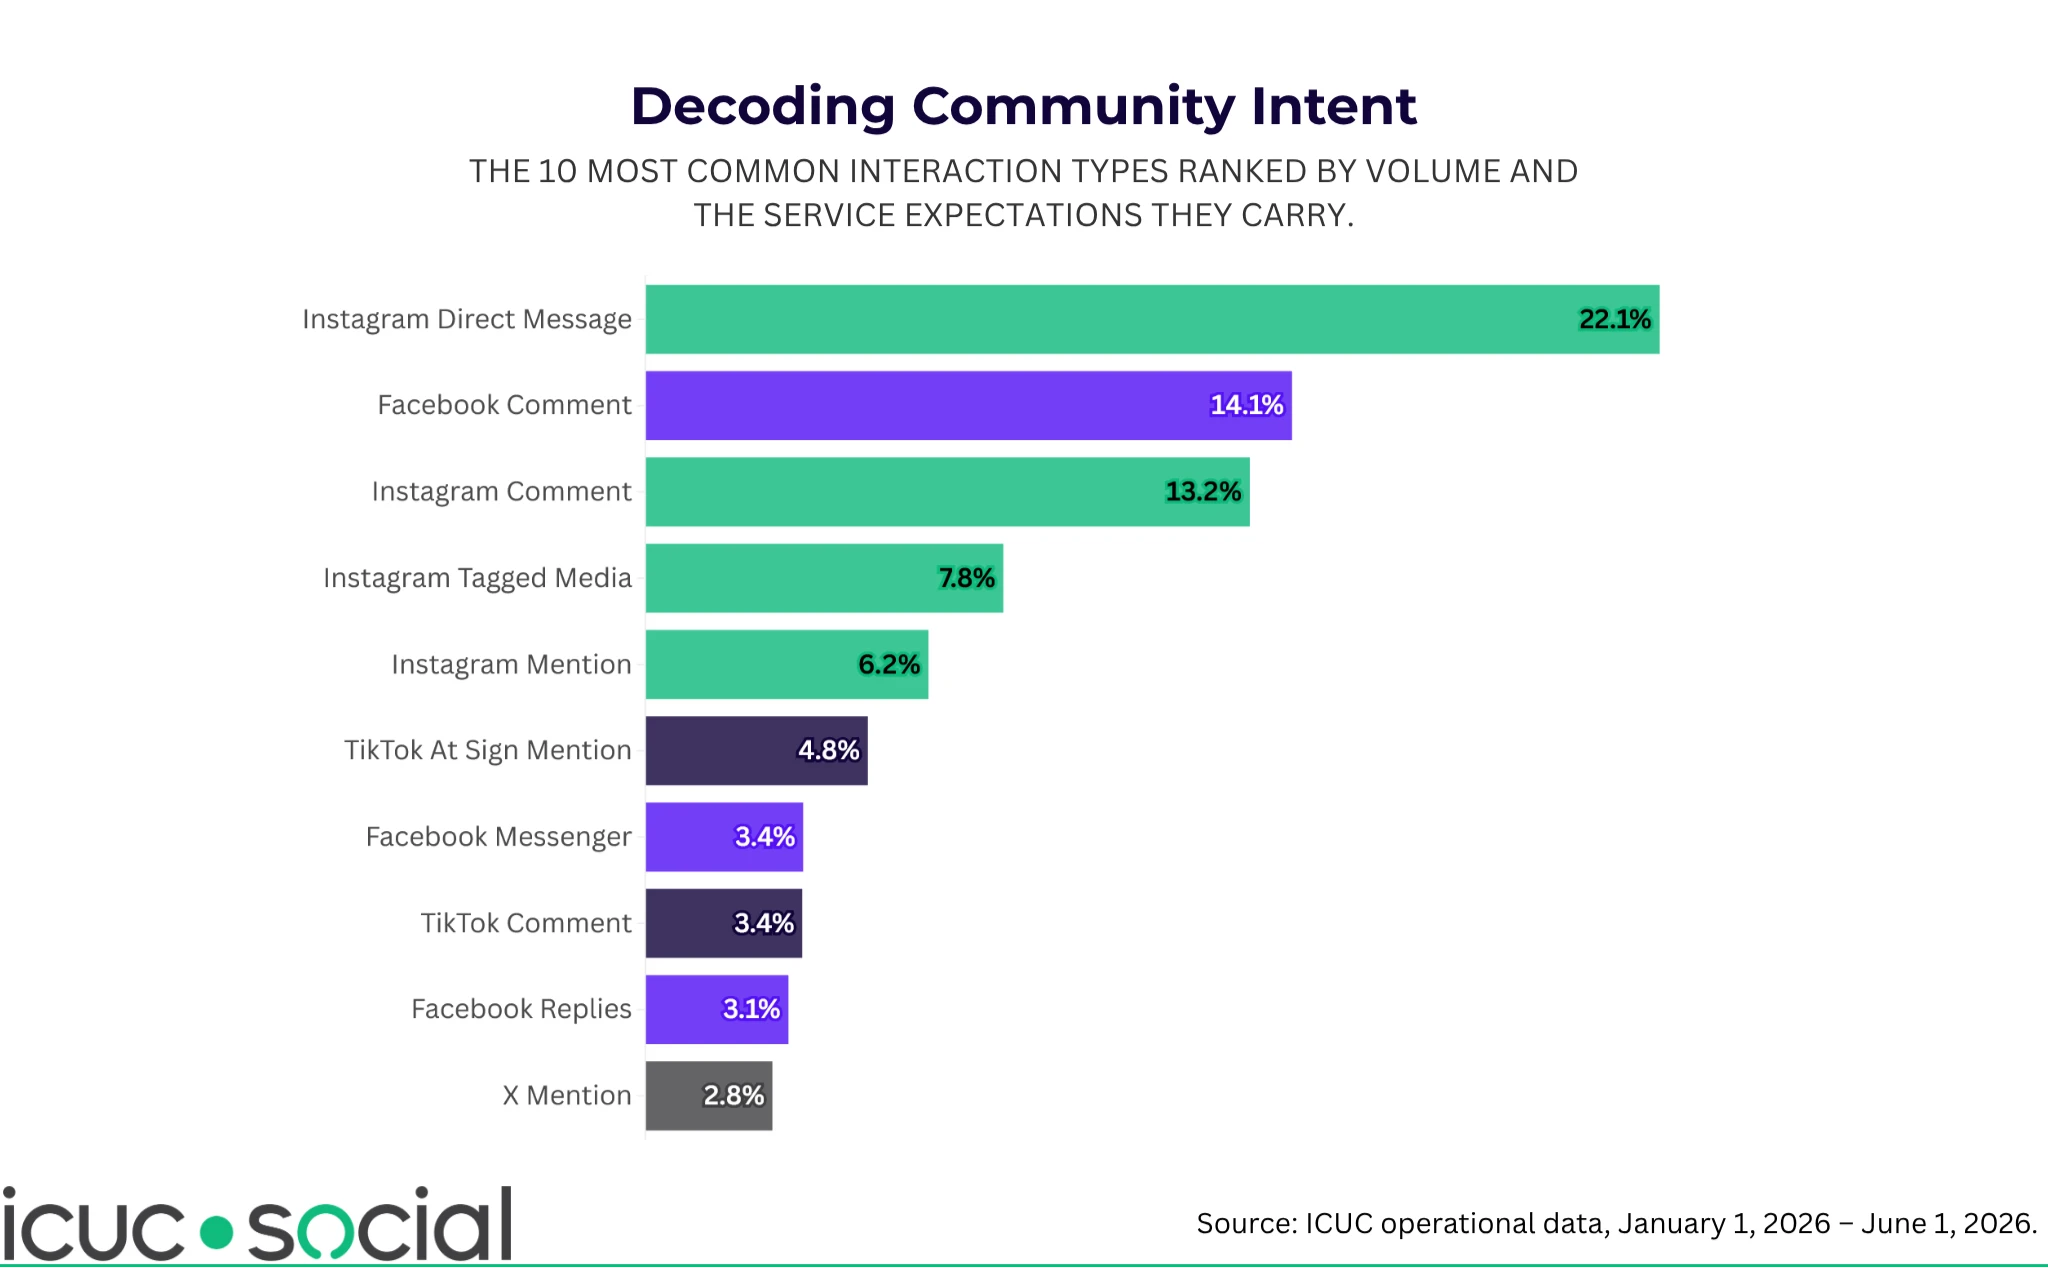
Across our dataset, Instagram is the most common platform for communities to interact with brands, accounting for just over half of all interactions processed across all post types.
Instagram DMs are the most common, making up more than one in five of all community interactions with brands. Three other interaction types on Instagram rank among the top 5, cementing Instagram's status as the modern hub for brand interaction.
The popularity of DMs in brand interaction is a trait unique to Instagram. On Facebook, TikTok, and X, the most common forms of interaction are public, in the form of comments or mentions. Instagram's private interaction being the most common changes the way brands moderate and respond on the platform.
Private and public interactions create different pressures. Private interactions often carry a higher expectation of service, care, and speed, because the customer is speaking directly to the brand, something that we will explore later.
On the other hand, public comments, by their nature, carry greater reputational and regulatory risk. The risks associated with public content mean that public channels often require careful moderation beyond just monitoring feeds.
The Most Moderated Channels
Public posts from customers directed at or mentioning brands can carry all kinds of risks, from regulatory risks to brand image risks. It is therefore a key part of community moderation to monitor and moderate all forms of public posts, whether automated, assisted, or fully manual.
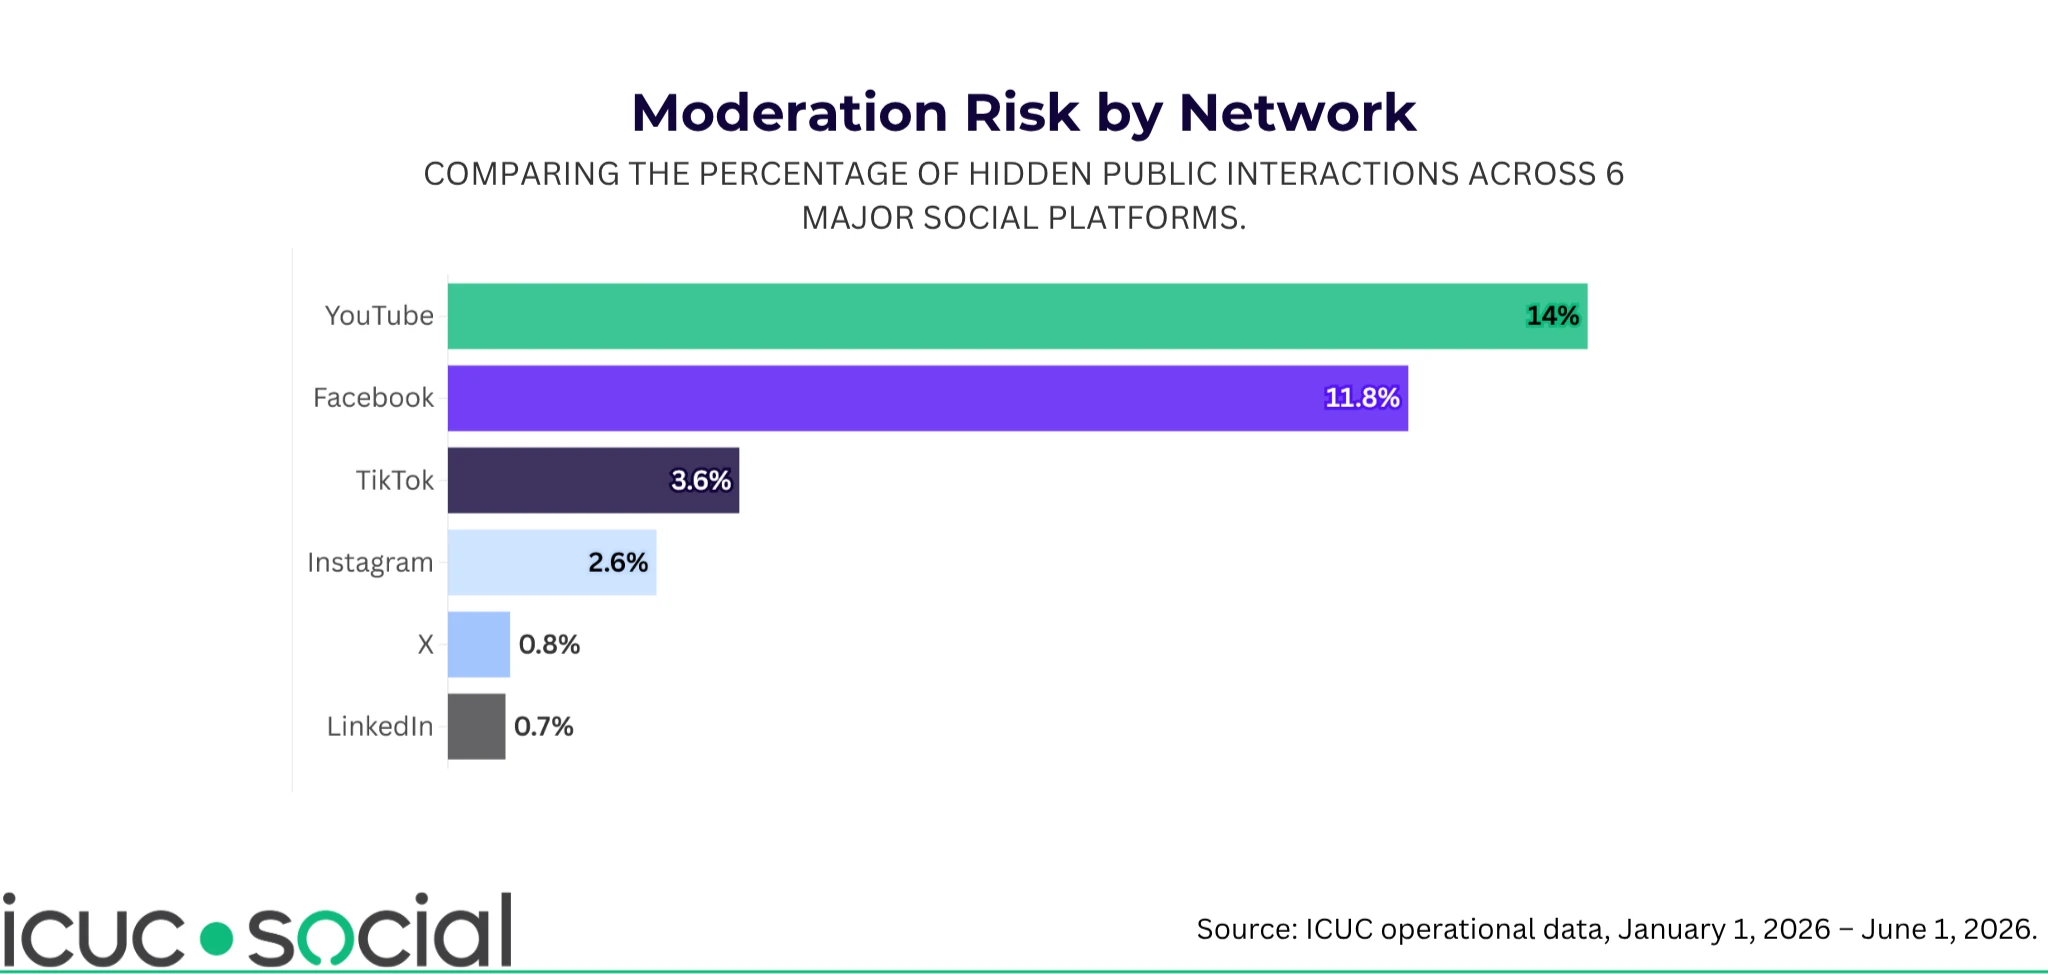
Alongside the huge popularity of private DMs on Instagram, public interaction on the platform accounts for about 30% of all brand interactions we see. Yet only 2.6% of those public brand interactions need to be hidden.
Facebook, the second-most-common network for public interactions, requires a much higher level of moderation. Public interactions on Facebook are hidden at more than four times the rate seen on Instagram.
However, within our data, the most heavily moderated platform is YouTube. A whopping 14% of brand interactions on YouTube were hidden during moderation. This is due in part to a mix of the platform's culture, the strength of its built-in moderation, and the type of content that lives there.
Platform dynamics explain part of the moderation picture, but the industry a brand operates in can further shape the burden it faces.
The Most Moderated Industries
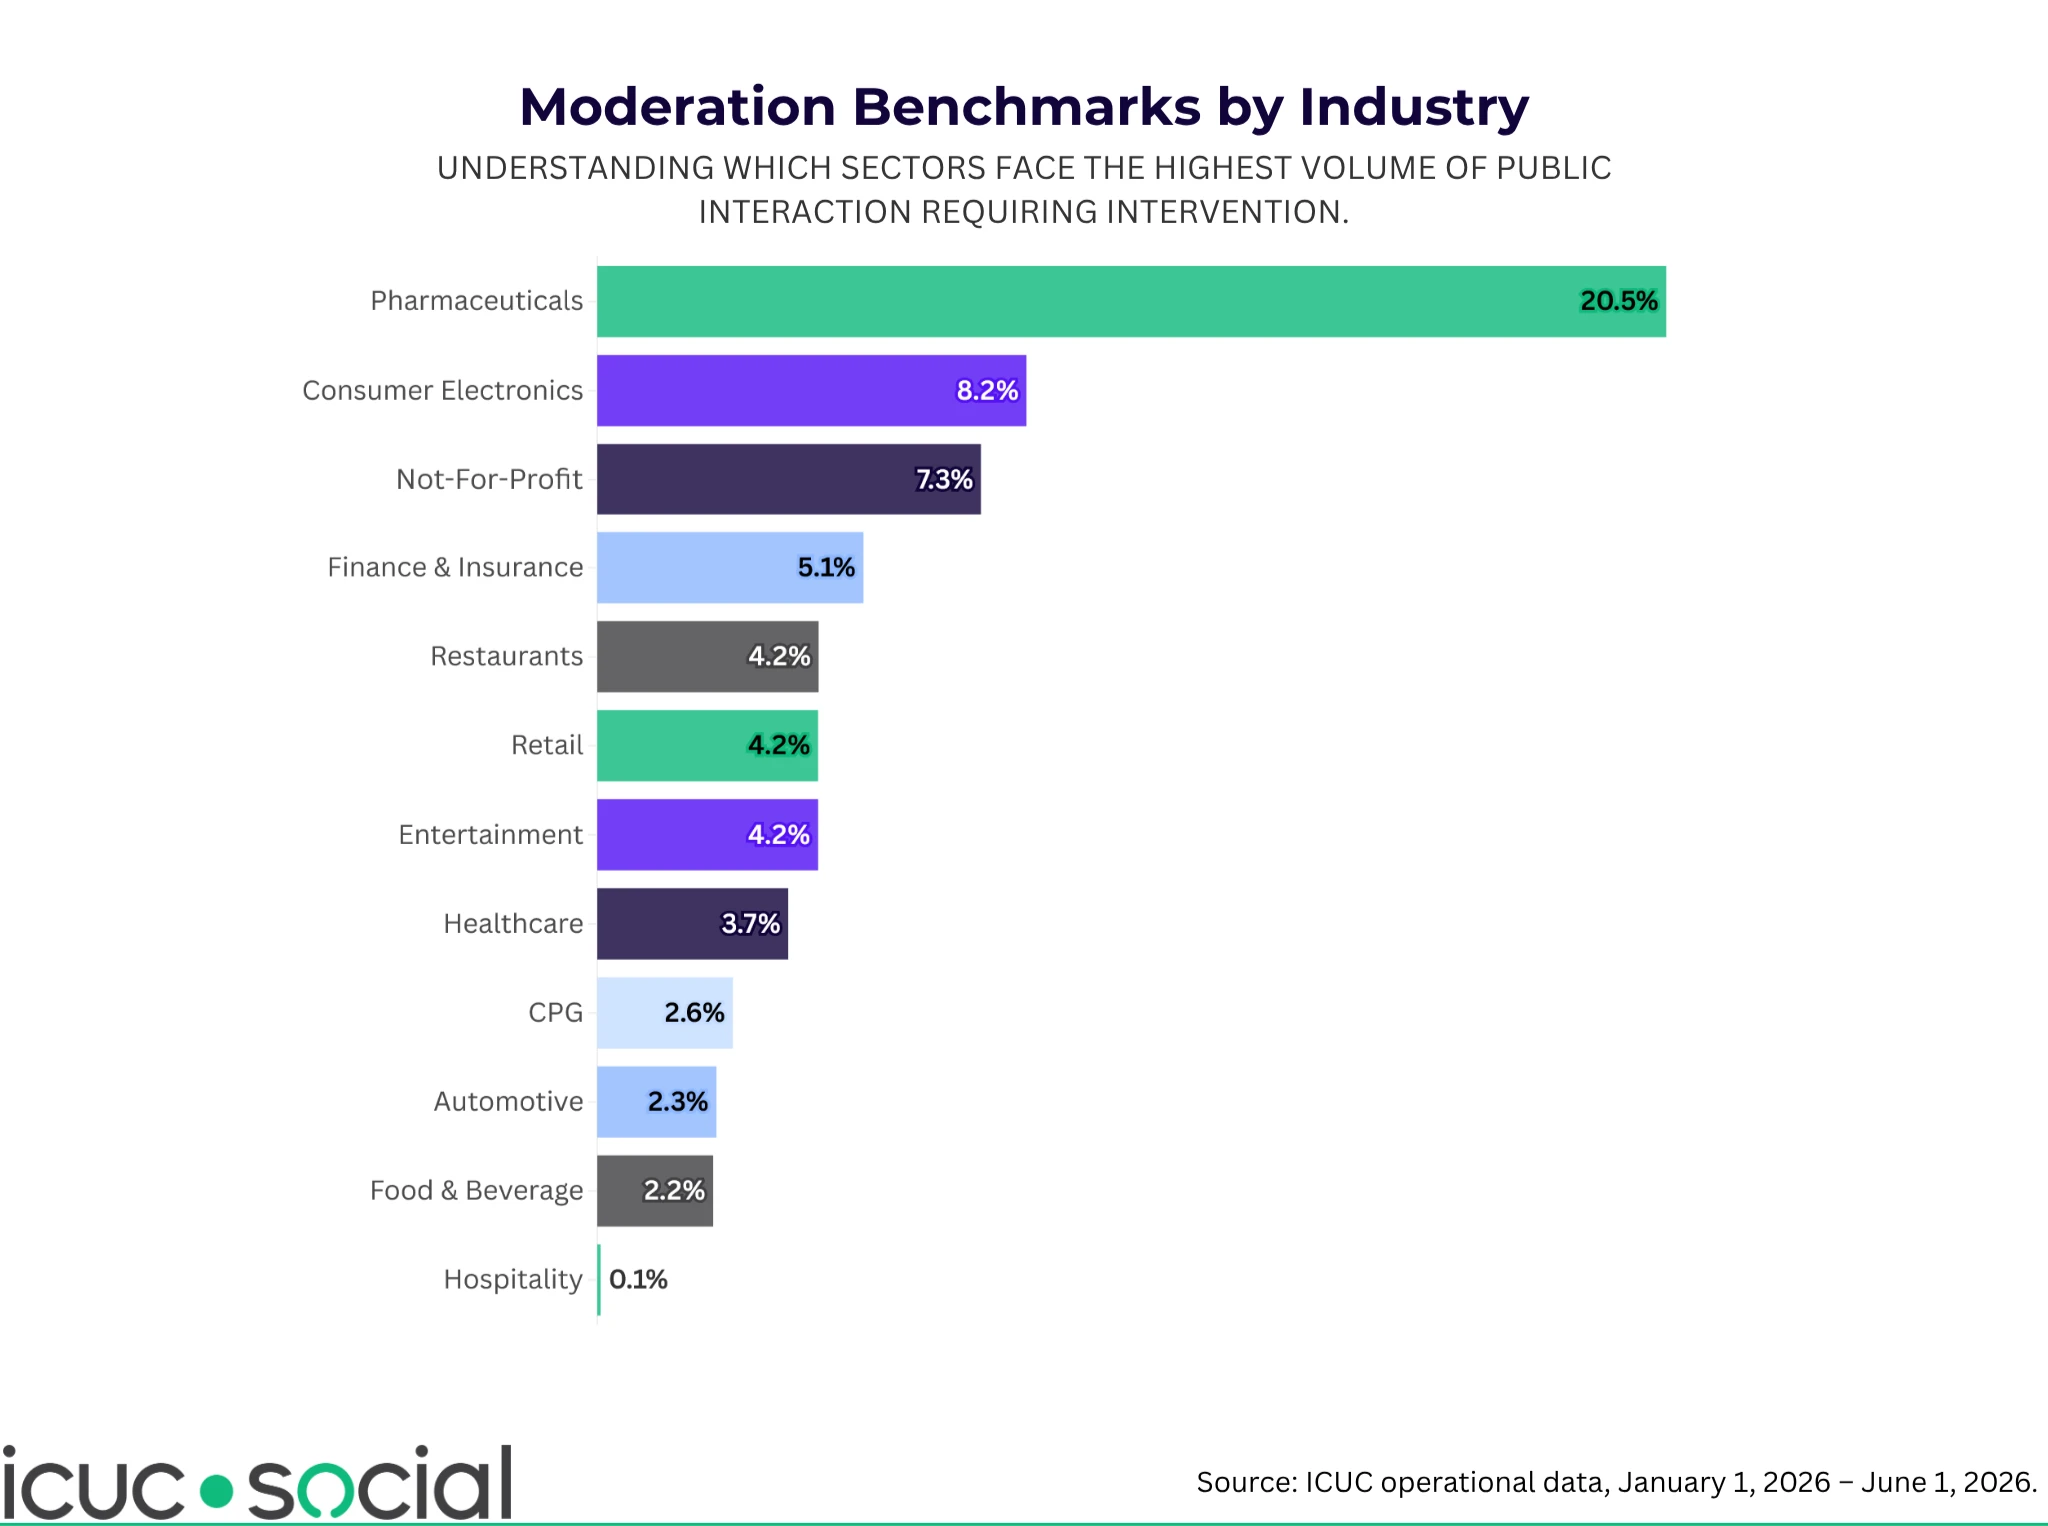
Among the industries analyzed, Pharmaceuticals is the most heavily moderated for public brand interaction online. Given the level of regulation in the sector, that should not come as a surprise.
Pharmaceutical brands need to consider more than just tone or brand image when monitoring their online interactions. As one of the most regulated industries, they must consider compliance, safety, misinformation, adverse events, and the need to manage public conversation within strict boundaries. The risk is greater, and the moderation threshold is naturally higher.
Most other industries sit close to the overall average, with around 4% of public interactions being hidden. That suggests that, for many brands, moderation risk is relatively consistent once platform differences are accounted for.
There are some other exceptions. Consumer Electronics and Not-for-Profits both require moderation at close to twice the average rate. These are very different sectors, but both can generate strong public feeling. Not-for-profit communities in particular can involve sensitive topics, polarized debate, or highly emotional discussion.
At the other end of the scale, hospitality requires very little moderation. That does not mean hospitality communities are quiet, but it does suggest that public interaction is less likely to cross the line into content that needs to be hidden.
Moderation shows the scale of the task brands face in community management, but in that sea of interactions are thousands of individuals asking for help. A brand’s response time shows its attention to detail for each customer.
Response Time
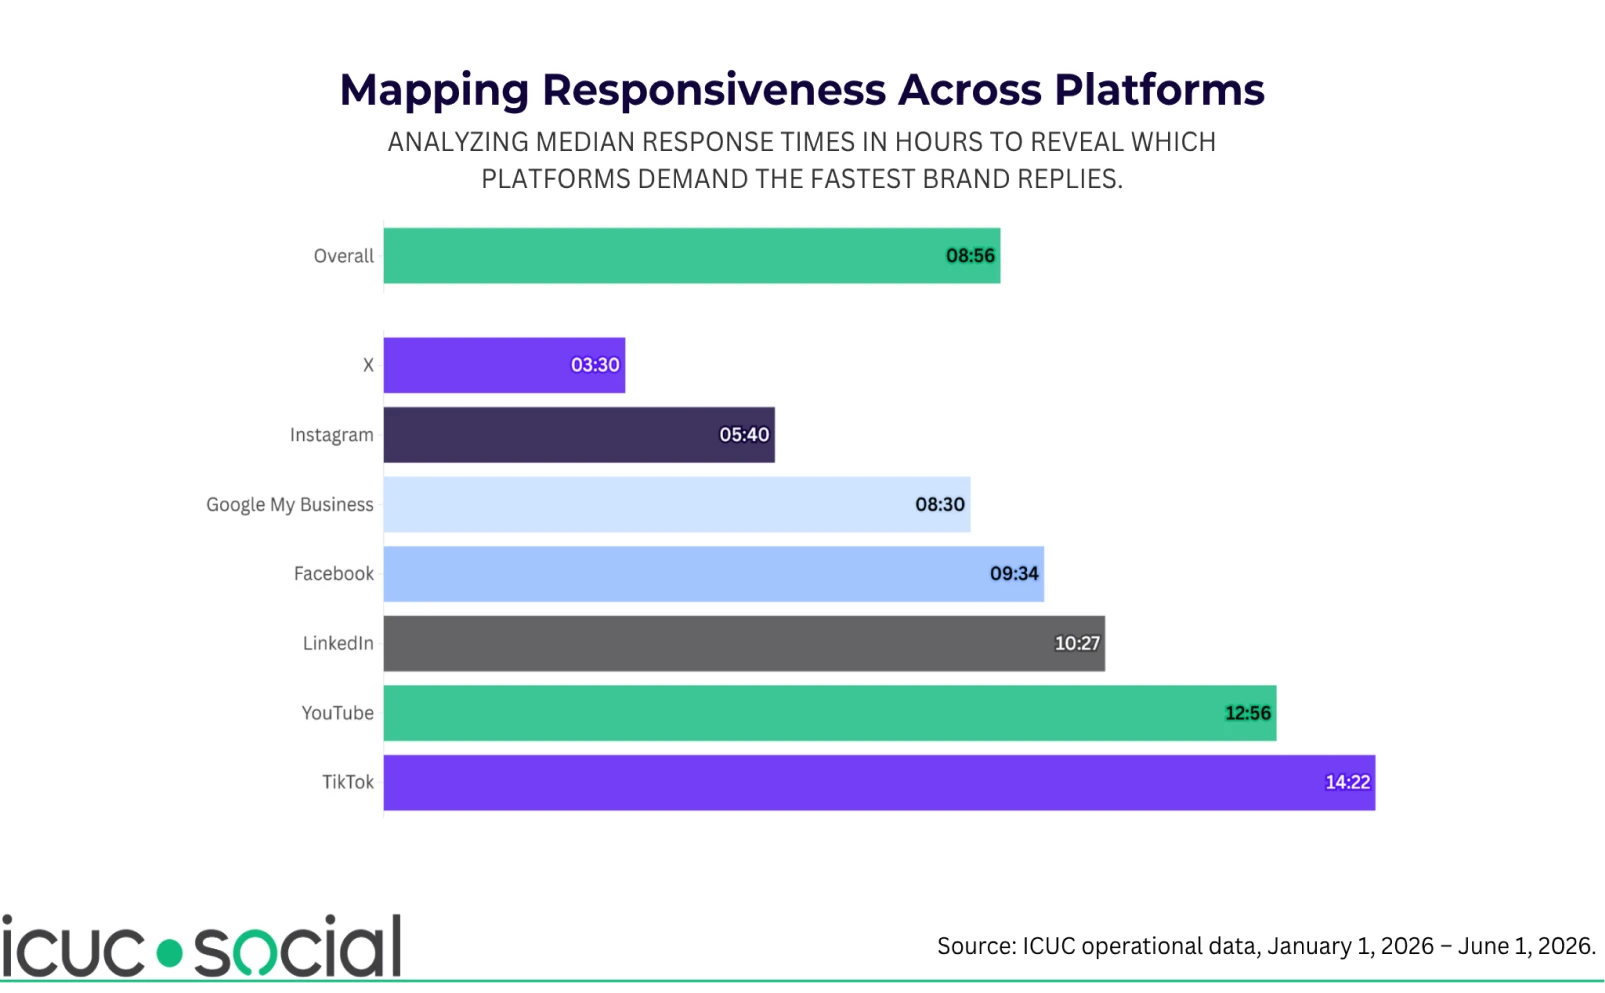
Across platforms, the average time it takes for a brand response is 8 hours and 56 minutes.
However, not all interactions carry the same expectations. Direct messages tend to receive the fastest response, with an average response time of 2 hours and 43 minutes. Comments follow at 3 hours and 45 minutes.
Mentions and wider social listening take longer, often closer to 24 hours. DMs and comments are usually more direct forms of customer contact. Mentions, especially those captured through listening, tend to be broader, less urgent, or less clearly aimed at the brand.
The platform used also changes the pace and expectation. The fastest responses tend to happen on X and Instagram. These platforms are built around immediacy, and customer expectation - and therefore brand commitment - follow that. X has been a hub for real-time customer interaction for years, while Instagram’s high volume of private messages creates a speedy service expectation.
The slowest response times are seen on video-based platforms such as YouTube and TikTok. These spaces are built around content engagement rather than direct customer service and interaction. Consequently, users place less emphasis on real-time communication, and brands are typically under less pressure to respond quickly.
Brands are expected to reply faster or slower depending on how a message is sent, but who the brand is, and particularly what they do, also carries weight.
The Most Attentive Industries
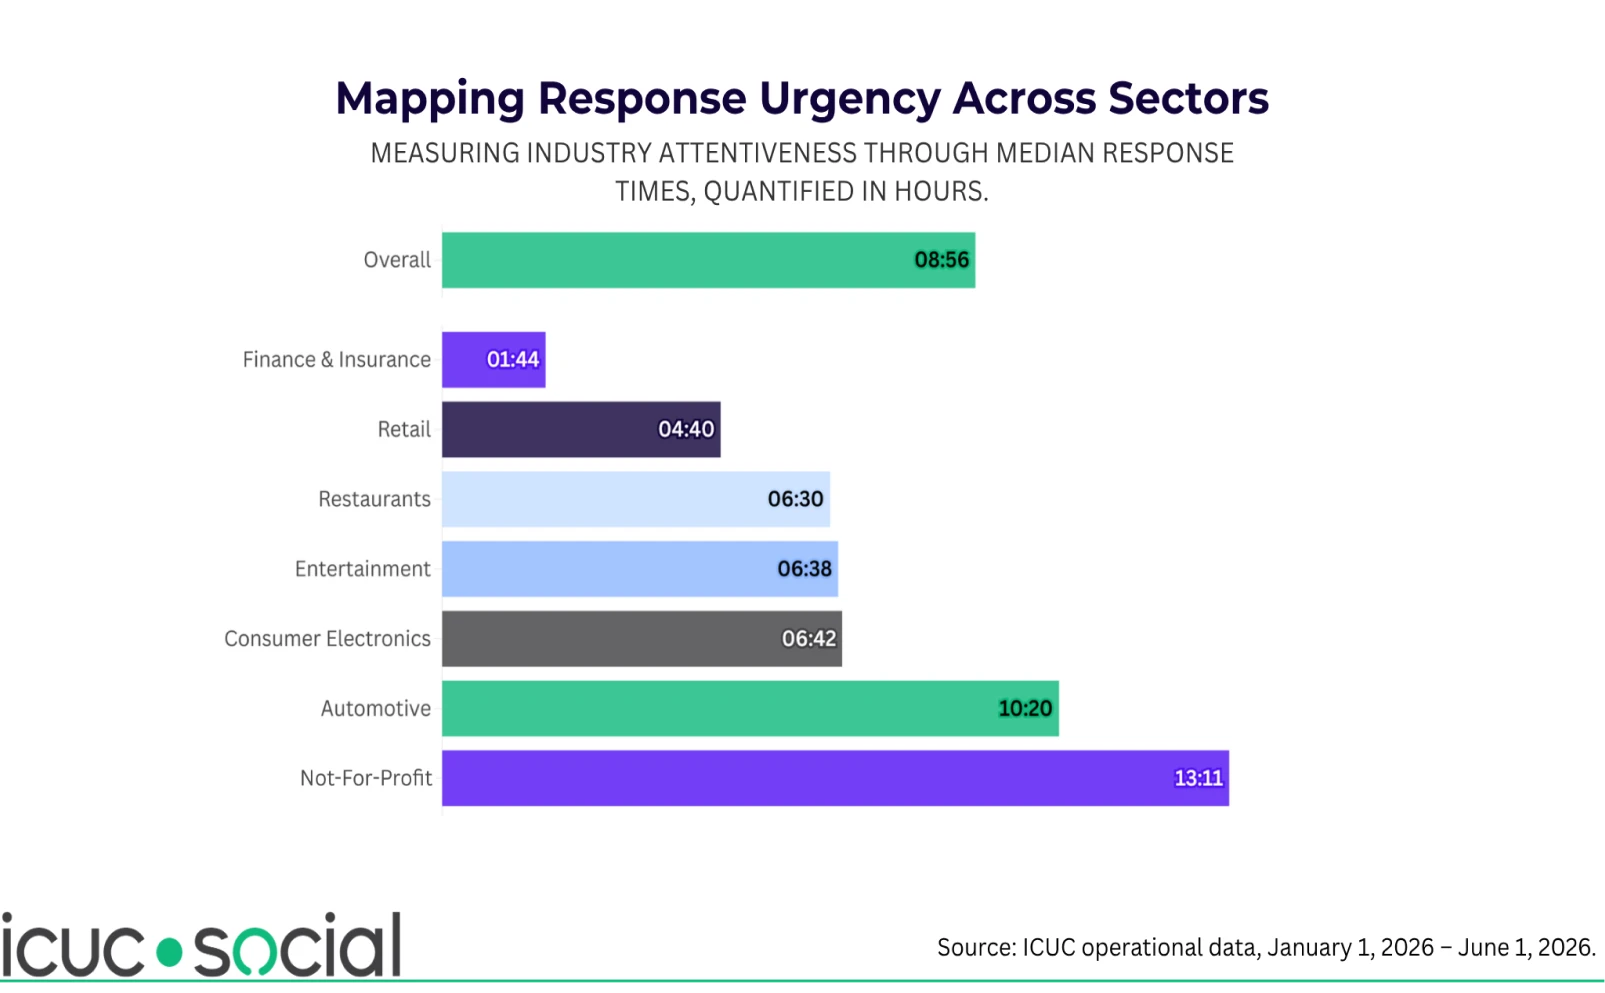
The industry a brand exists in dictates expectations upon them. The channels they use, the content they produce, and the speed at which they respond.
Our data shows that Not-For-Profits tend to respond more slowly than other industries, with a median response time of 13 hours and 11 minutes.
Finance and Insurance brands sit at the other end of the scale. These businesses face much greater pressure to reply quickly, and they are doing so with strong results. Their median response time is more than four times faster than the overall median, making it the only industry tracked with a response time under two hours across all message types.
When finances are involved, customers often seek urgent reassurance, support, or clarity on issues that can have massive personal stakes. A slow response can quickly become a trust issue.
Conclusion
Community management is defined by scale, complexity, and expectation.
Customers want their issues solved, but they also want to feel heard – something that automation cannot guarantee. We believe the strongest community operations use automation where it adds structure and speed, while keeping human expertise at the center of judgment, empathy, and risk management.
The busiest spaces are not always the riskiest. The most moderated platforms are not always the largest. The fastest response times are not evenly distributed across sectors. Each brand must tailor the way they manage their online community relative to the spaces they occupy. Be it from industry or platform, it is audience expectations that shape community management.
Methodology
The data used in this report are drawn directly from ICUC's in-house tracking of 3,336,259 online interactions, 2,712,378 of which ICUC managed on behalf of clients between January 1, 2026, and June 1, 2026.
Industries were assigned to each business through manual research. Where findings are broken down by industry, only industries in which ICUC managed interactions for at least 5 unique businesses using the relevant management method are included. This threshold was applied to ensure findings are based on a sufficiently broad sample and to protect client confidentiality.
About the Author

Nicole van Zanten
As Chief Growth Officer at ICUC, Nicole leads global growth across marketing, client success, and business development. With over 15 years of leadership in social media, content strategy, and digital transformation, she brings a unique mix of creative vision and operational rigor to building high-performance teams and sustainable revenue growth.